Graph Functions by Plotting Points
Let's say you have a function. What does it look like? How do you graph it? In this lesson, we'll learn how to graph functions by determining and plotting points.
Functions
Imagine it's a dark and stormy night. You're lost in the woods. You sense there's something chasing you. You start to run, but you trip over a fallen branch. You turn over and look behind you. And there, in a flash of lightning, is this: f(x).
Wait, hold on. You don't have to be afraid of functions. I know - they look scary. Where'd that f come from, and what does it mean? And, why is it holding that x prisoner? Functions have intimidated math students for as long as there have been bad stories that start with it being a dark and stormy night.
But, in this lesson, we're going to see that functions are just like any other equation. And, in fact, it's very simple to make a graph of a function.
First, let's get a few things straight. A function is a rule that uses an input to produce an output. Let's say you see f(x) = 2x. That just means that for each value of our input, x, our function, f, produces an output of 2x.
So, if we input 5, our output is 5*2, or 10. If we input 7, our output is 7*2, or 14.
So, f(x) = 2x is actually similar to y = 2x. Again, if x = 5, y = 10. In this equation, y is a function of x. The value of x determines the value of y.
Now we can get into graphs. The graph of a function is a visual representation of all of the points on the plane of (x, f(x)). Note that f(x) is taking the place of y in that ordered pair. This graph we're making is just a collection of points.
You know that famous painting by Seurat? The one that looks like a normal picture, but when you look closer, you see that it's really a collection of countless tiny dots? A line on the graph is the same thing. It's just an infinite number of dots.
Find Ordered Pairs
To graph a function, we take that idea and follow a simple three-step plan. Let's try this out with this function: f(x) = 3x - 4.
Okay, let's start. Step one: Find ordered pairs. Your ordered pairs are your dots. If you could find an infinite number of them, you'd have your graph. But, we don't have time for that here, though that could be a fun project.
We're just going to fill in the chart below.
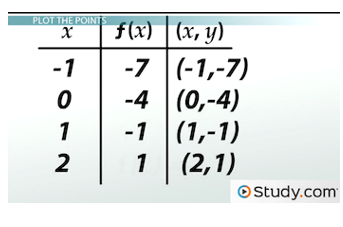
A chart is helpful for finding ordered pairs.
In the x column, let's pick some numbers. It doesn't matter too much what we pick, but we want to make sure that if this line curves, we check enough numbers to notice that. Let's use -1, 0, 1, 2.
To find the ordered pairs, we plug our x values into the function. Start with -1. Just plug that into our function: f(-1) = 3(-1) - 4. So, our f(x) value here is -7. Let's add that to our chart. That means our first ordered pair is (-1, -7).
0 is next. f(0) = 3(0) - 4. That's just -4.
Next is 1. f(1) = 3(1) - 4. That's -1.
Finally, there's 2. f(2) = 3(2) - 4. That'll be 2.
Plot the Points
Okay, we have our points. Now comes Step two: Plot the points. Let's move over to the coordinate plane and plot these ordered pairs.
First is (-1, -7), and then there's (0, -4). If you know you have a straight line, you really only need two points. But, we're being cautious and plotting four points.
So, there's (1, -1), and there's (2, 2).
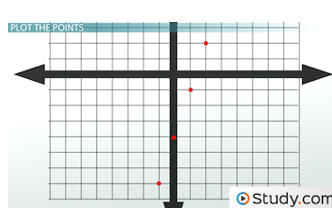
Step two is to plot the ordered pairs.
Connect the Dots
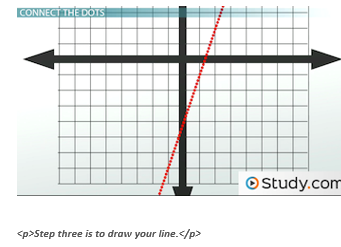
That leaves our final step: Step three: Connect the dots.
You probably practiced this in preschool. Did you know then that connecting the dots would be a practical skill in advanced math?
Anyway, before we connect the dots, let's make sure we know what they're doing.
Some functions have curves. You'd be able to tell because a straight line wouldn't go through all of our points. But, if we draw a line through our points below, it does. So, we have our line. And, that's the graph of f(x) = 3x - 4.
Practice Problems
Now that we know the three steps, let's get some practice.
First, let's try f(x) = -3x + 6. Remember step one? Find ordered pairs.
Let's make a chart. Okay, now pick some values for x. How about we try even numbers? -2, 0, 2 and 4.
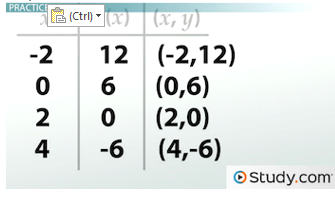
Chart for practice problem 1
Next, plug them into our function. f'(-2) = -3(-2) + 6. That'll be 12.
f(0) = -3(0) + 6. That's just 6.
f(2) = -3(2) + 6. That's going to be 0.
Finally, f(4) = -3(4) + 6. That's -6.
I'm noticing a pattern here.
Okay, step two: plot the points. There's (-2, 12) below. There's (0, 6)