Loading...

Graphing Basic Functions

Video Lesson on What is a Function: Basics and Key Terms

Graphing Basic Functions

Graphs are just like maps - when you know the language! Review how locations have x and y coordinates similar to latitude and longitude, and how to plot points in the Cartesian plane.

Maps and Graphs

41 -12819772

Latitude and longitude help us to identify a single point on a map with just a set of numbers.

Have you ever compared maps from centuries ago to Google Earth? The guys back then were way off! I mean, look at this guy. He says that California is an island. Well, I guess they didn't really have GPS to give them the latitude and longitude when they were mapping coastlines. Latitude and longitude are important because they give the coordinates of every point on a map; they allow you to identify a single point with just a set of numbers: a latitude and a longitude. With a latitude and a longitude, you can identify any location on the globe. For example, San Francisco is 37 degrees north of the equator and 122 degrees west of England. There's no other city that's at exactly this latitude and longitude.

In math, we often use a Cartesian plane as our map, and x and y points instead of longitude and latitude. We draw some mathematical map with an x-axis - that's kind of like the equator - and a perpendicular y-axis - that's kind of like the Prime Meridian, that thing that goes through England. We can then plot any point on this graph, or map, by identifying its unique location, its longitude and latitude, if you will. So each point has an x-location, defined as the distance from the y-axis. The x-location is going to have a positive value if it is to the right of the y-axis and a negative value if it is to the left of the y-axis. The y-axis itself is at x=0. This point also has a y-location; this is the distance from the x-axis. This is like how far north you are from the equator. It's given a positive value if it's above the x-axis and a negative value if it's below the x-axis. This x-axis is defined to be at y=0. This means that we can plot any point by representing it in what's called an ordered pair: (x,y). For example, we can plot the point (5,4), which is an ordered pair. (5,4) is where x=5 and y=4. So I'm going to count 5 over from the y-axis, and I'm going to count 4 up from the x-axis.

42 -58187880

A Cartesian plane is like a map containing x and y points instead of latitude and longitude.

Ordered Pairs and Quadrants

You can do this with almost any point, like (3,1). That's 3 over to the right and 1 up. The point (-1,0) is 1 to the left and 0 up. Just remember that your first number is going to move you left and right, and your second number is going to move you up and down. The point (2,-2) is going to move me 2 to the right and 2 down. The point (0,0) is where the x and y axes meet. That has a really special name, the origin. Around the origin, separated by the x- and y-axes, are the four quadrants: I, II, III and IV.

The first quadrant is where both the x and y values are all positive; they're all greater than zero. So this would be like where the Northern Hemisphere meets the Eastern Hemisphere. In the second quadrant, all of the xvalues are negative, because we're on the left-hand side of the y-axis, and all the y values are positive, because we're above the x-axis. This is like where the Northern and Western Hemispheres meet. In the third quadrant, x< 0 and y < 0. This is like where the Southern and Western Hemispheres meet. Finally, where the Eastern and Southern Hemispheres meet, we have the fourth quadrant, where x > 0 and y < 0.

Usually we want to plot lines and curves, not just single points. Imagine the conflicts with Canada if we could only plot a few points to represent our border! In reality, there are an infinite number of points infinitely close to one another. So if I zoom in on the border, it might look like there are points, but those points touch. They're continuous, representing a line.

Graphing Functions

43 -40280168

The 4 quadrants on a graph

The same thing holds true with regular equations, like y=2x. There is a point, y, for every single value of x. We can plot this equation by just plotting a number of points, each of which satisfies this equation. Let's draw a few of these out. When x=0, y=0. Well, that's at the origin. When x=1, y=2. When x=pi, which is still just a number, y=2(pi). If x=-1/3, y=-2/3. All I'm doing is plugging in different values of x and seeing what y is. I can plot those on a graph, and if I plot enough of these points, I can connect them with a smooth curve.

We use the same idea for equations like y=x^2. Here, if x=0, y=0 satisfies this equation, because 0=0. Again, we're just going to go through the origin. When x=1, y=1. When x=2, y=2^2, or 4. When x=3, y=9. When x=-1, y=1, and so on and so forth. I can connect these with a smooth curve and my graph looks something like this.

We can do this for a more complex function, like y = (x - 1)^3 - x^2 + x + 2. Let's create a table of values. When x=-2, y=-31; so that's all the way down here. When x=-1, y=-8; that's here. At x=0, y=1, so we're not going through the origin; (0,0) does not satisfy this. When x=1, y=2. When x=2, y=1. When x=3, y=4. And when x=4, y is all the way up here at 17.

44 Dup 1 -27691618

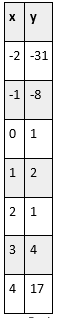
So I can connect these with a smooth curve, and I get this kind of loop structure. You'll see this pretty often when you see x^3=y.

Sometimes, we'll want to plot something like y=4. Well, what is x in this case? Let's look for ordered pairs that satisfy this equation. Well, when x=0, y is going to be 4. When x=1, y=4. When x=-32, y=4. It really doesn't matter what x is; y is always 4. This is going to give us a horizontal line, because x can be anything, but y always has to be 4.

45 Dup 1 -64414824

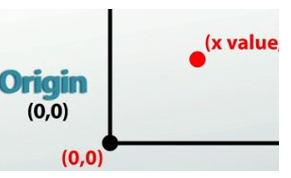
The origin is the point at which the two axes intersect.

Lesson Summary

So let's review. We will be graphing equations and points, mostly on a Cartesian plane, which is just like our map. We have a horizontal x-axis, which is just like the equator, and a vertical y-axis, which is like that Prime Meridian. Each point on our plane has a coordinate represented by some ordered pair of an xvalue and a y value. This is like a point on a map having a latitude and a longitude.

The origin is the point where the two axes intersect, so it's at (0,0). Also, the axes divide our map, or graph, into four different quadrants: I, II, III and IV. Finally, if you want to plot an equation, you want to create a whole bunch of ordered pairs that satisfy that equation. Then you want to connect those ordered pairs using a smooth line. Just make sure the ordered pairs are very close to one another before you connect them.

3456789

Further Topics

Topics Main Topic

Current Menu

Random Topics

More for You
All in this Category

You may be interested in

Colleges in Islamabad

A comprehensive list of major colle ...

Colleges in Bahawalpur

Find colleges in your area in Bahaw ...

Interview Call Winning Resume

Learn how to write Interview Call W ...

Making Millions

How to become a successful person i ...

The Avicenna School - Karachi

The Avicenna School belongs to bis ...

Schools in Khuzdar

A comprehensive list of major schoo ...

Schools in Barking and Dagenham

Find a comprehensive list of popula ...

Schools in New Addington

Find a comprehensive list of major ...

Antonyms

Effective strategies and practice q ...

SAT Reasoning Preparation

How to prepare for SAT Reasoning pa ...