Now that we've solved the compound inequality, we can graph it by doing one piece at a time. I can start by putting x > 13 on the graph by putting an open circle at 13 because it's just greater than not equal to and drawing an arrow to the right to indicate all the values that are bigger. I can put x >_ 15 by putting a closed circle, a filled-in circle, at 15 to indicate that it could be or equal to and an arrow going to the left to indicate that it's all the values that are smaller than that. Because this is an AND inequality, I need both things to be true, which means the only solutions are the ones where both graphs are, where they overlap.
Practice Problem #3
On to example three:
Graph 2x - 3y > 6
This is our first 2-variable inequality question because we've got xs and ys. Although we need to indicate on our graph where 2 x - 3y > 6 , we first need to find the boundary line between the greater than and less than regions. This boundary line right in between greater than and less than is where 2x - 3y = 6. So, we can first use our linear equation graphing skills to plot this line.
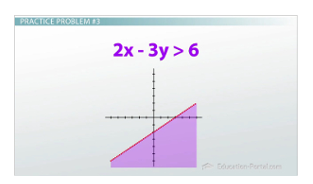
Graph of the inequality in problem #3
Because this line is in standard form, we could use the intercept method, which is a shortcut, to substitute in zeros for x and y to find the corresponding points, put those points on our graph, connect them to find our line, but I've found that most students would rather put the question into slope intercept form and go from there.
In order to use this slope intercept method, we first have to get the y by itself using inverse operations. Undoing the 2x and undoing the -3 in front of the ygives us our slope intercept form of this equation:' y = 2/3x - 2. The slope intercept form of our equation tells us that -2 is our y-intercept. It's our beginning value. So, I go down to -2 on our graph and put a point. Next, I use the slope to tell me to go up 2, over 3 to find our next point, and I connect my two points to get my line: y = 2/3x - 2.
Just to point out that the shortcut intercept method would have worked, realize that the two points we found in that shortcut are these exact two same points that we graphed here. So, either way works.
Now that we have the boundary line drawn where 2x - 3y = 6, we need to find the area of the graph where 2x - 3y > 6. To figure out which side of the boundary is the greater than side, we can substitute in a test point and see if it works. 0,0 is often the easiest one to try, so plugging that into our original inequality gives us 2(0) - 3(0) and we want to check - Is that greater than 6? Simplifying the expression down gives us the statement that 0 > 6, which is, obviously, not true. Therefore, that means the side of the line that 0,0 is on is not the greater than side, but it is the less than side. Which means that all the points above the line are where 2x - 3y < 6. Because we want the greater than side, that means that our answer is not above the line, but below it. The area where 2x - 3y > 6 is everything below the line we drew earlier. Lastly, noticing that our inequality was strictly greater than and not equal to, we need to change our boundary line to a dotted line to indicate that it is not part of our solution.
Practice Problem #4
For our last example, let's simply add more 2-variable inequalities to the last problem and turn it into a system of inequalities:
Graph 2x - 3y > 6 and y <_ -x and y > -3
Since we already know what the first inequality looks like (it looks just like our last problem), we can start with that one on our graph. But now, because there are multiple inequalities in one problem, we need to put the other ones on the same set of axis as this one. We can simply do one at a time.
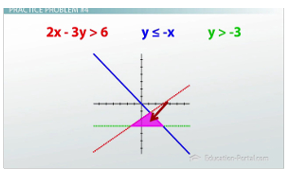
Graph of the system of inequalities in problem #4
Let's start with our second one: y <_ -x. This is already in slope intercept form, although it may not really look like it as y <_ -1x + 0. That means I can begin the graph at 0, go down one over one, connect the dots, and I end up with the line, like so. To find out which side to shade we need to test a point, but our typical tester the origin 0,0 is out because it's right on the line, so it's not going to tell us much useful information. You could pick any other point you want. Doesn't matter as long as it's not on the line, as long as it's obviously on one side or the other, but I'll go with 2,2.
Substituting in 2,2 into the inequality y <_ -x gives us the statement 2 <_ -2, which is not true. Therefore the side of the line that 2,2 is on is not the side we want to shade, and we shade everything below it. We now have to remember that we are graphing a system of inequalities, which means our answer is only the area where the shading from both inequalities intersect. This means that so far our answer is only the triangular region underneath both lines.
We can now lastly add in our last inequality, y > -3. The type of inequality in this problem can be deceiving because there's only one variable, but when the problem gives us restrictions on y, it implies that x can be whatever we want. This means we continue with the normal method and graph the boundary line, y = -3.
Y equals lines in a coordinate plane are horizontal lines at the value it states, so this line is simply a left and right line directly at -3. We can still substitute in a value to see if it works, and 0,0 is valid again because it isn't on the boundary. Since we don't care about what x is, simply putting in 0 for y gives us the statement 0 > -3. This time that's true, so the 0,0 side of the y = -3 line is the side we want. We shade everything above this line.
We have to remember to make it a dotted line when it is strictly greater than, so we can go ahead and erase little bits of the line to make this a dotted line. Finally, taking into account that it's a system of inequalities, our solution is, again, only the region where this new shading intersects the shading from the previous two inequalities. Erasing all the areas where this new shading is by itself and only leaving the areas where this new shading intersects the others, gives us our final answer as the small triangular region that is above the y equals line, but below both diagonal lines. Any x,y coordinates found in this region will make any of the three additional inequalities true if you plug in the points.
Lesson Summary
To review:
- When solving inequalities, you must flip the sign any time you multiply or divide both sides by a negative number.
- The graphs of 1-variable inequalities go on a number line and look something like this.
- The graphs of 2-variable inequalities go on coordinate planes and look something like this.
- All systems of 2-variable inequalities are AND problems, which mean the solutions are only the regions of the graphs that overlap.