How to Graph 1- and 2-Variable Inequalities
So an inequality is just an equation with a less than or greater than symbol. But what is the difference between 1 and 2 variable inequalities? What does have a greater than or equal to symbol change? When do you use a number line instead of a coordinate plane? Get those answers here!
Graphing a 1-Variable Inequality
All right, so you know that an inequality is an equation with a greater than (>) or less than (<) symbol instead of an equals sign (=). You know they're nice for expressing situations where there can be at least, or no more, than some amount. But what is it that you really need to know? What are you going to be asked to do, and how should you do it? That's what this video is going to focus on.
The thing is, inequalities are a broad enough topic that they can appear in lots of different places; from quadratic equations to cubic, logarithmic, exponential, rational, the list goes on and on. So, in order to limit the amount of other things you have to worry about, we're going to introduce inequalities in the easiest place you'll find them: linear equations.
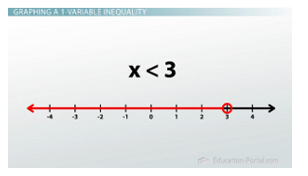
Line graph for x is less than 3
So, here we go with a linear inequality:
Solve and graph 4x + 3 < 15.
It's an inequality because it has a < symbol, and it's linear because the x isn't being raised to any fancy exponent. We also know that any time we're asked to solve something, it's our job to figure out what value makes the statement true. And just like linear equations, linear inequalities can be solved using inverse operations to get the variable by itself.
Undoing plus 3 with minus 3, and then undoing times 4 with divided by 4 leaves us with our solved inequality x < 3.
So, instead of just one value that will make the original statement true (like an equation), here, any number that is less than 3 will work. That means there are tons of right answers: 2, 1, 0, -5, -10, -1,000, negative...whatever. So instead of making one gigantic list, graphs are used to represent all the possible solutions in one clean picture.
When I think about making a graph, I have to think about what kind of inequality this is.
This is a 1-variable inequality because there's only one variable, x. So, that means our graph will only have one axis, and therefore be called a number line. We often start by putting 0 on the number line, then working our way over to the point 3, we put a circle there to indicate that is the boundary point between the good answers and the bad ones. We then draw an arrow to the left to indicate that all the good answers are smaller than 3. And we're done!
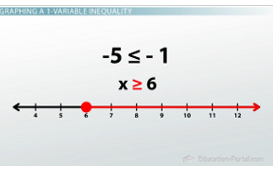
Line graph for x is greater than or equal to 6
If instead our problem would have had a less-than or equal-to sign instead, we would also want to fill in our circle at 3 in to indicate that we want to include that number -the boundary point - in our 'good list' of possible solutions.
So far, inequalities are no different to solve than equations. But there is one difference. The example solving 5 - x is less than or equal to -1 will show that difference.
Well okay, undoing the 5 with subtraction and then undoing the -1 with division leaves us with x is less than or equal to 6, great right? Uhhh, not so much. Less than 6 you say? Okay, so 0 should work right? But wait, when I put 0 in for x, I get 5 is less than or equal to -1, that's definitely not true. So, what happened?
Well, when we divided both sides by -1 to get rid of the negative in front of the x, what we were really doing was making the x and the -6 switch sides of the inequality. When this is an equation and there's and equals sign, this is no problem; x = 10 is the same as 10 = x. But if it's an inequality, doing this changes the sentence we have; x > 10 is different than 10 > x.
Therefore, there is one Golden Rule about inequalities that make them different than equations. Anytime you multiply or divide both sides of the inequality by a negative number, you must flip the inequality symbol around.
If we would have used this rule the first time, our answer would have instead said x is greater than or equal to 6. Just to make sure that works out, let's check it real fast. So, 10 is bigger than 6, so if we substitute 10 into our original equation, 5 + 10 = -5 and -5 is less than or equal to -1, so we're in good shape.
Graphing our solution now simply requires us to draw a number line, work our way over to 6, put a circle there, fill it in because it's 'or equal to', and then draw an arrow to the right, indicating anything bigger than 6 is good to go.